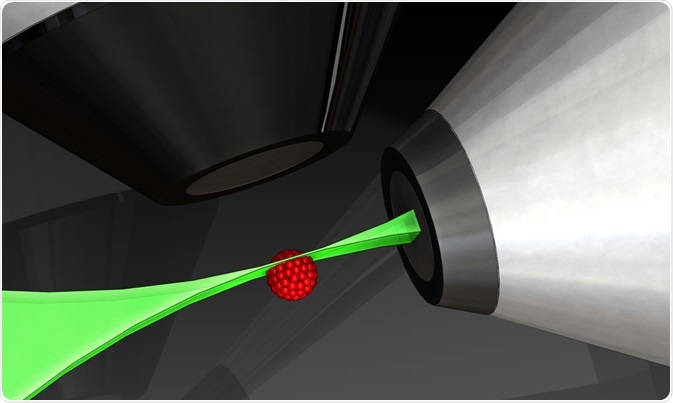
Fluorescence microscopy and flow cytometry are bioanalysis tools used to quantify the total number and type of cells in a sample. Both methods have widespread usage but differ slightly in their application.

Micha Weber | Shutterstock
What is fluorescence microscopy?
Microscopy existed prior to flow cytometry and was an integral part of its development. A fluorescent microscope, in simple terms, is an enhanced light microscope which uses a light of higher intensity to excite fluorophores in the specimen.
The excitation of fluorophores (or fluorescent species) prompts them to emit light at a lower energy with longer wavelengths, which produces the magnified image. It is usually applied to specific cell characteristics. The fluorescence is achieved using antibodies tagged with fluorophores which target specific features. However, staining can also be far less specific.
What is flow cytometry?
With flow cytometry, the properties of cells can be quantified. This is done on an individual basis for each cell and includes measurements such as cell size, granularity, and quantity of cell components (such as DNA, messenger RNA, and intracellular proteins).
The quantitative values derived with flow cytometry can be both relative and absolute values, but are typically relative. Flow cytometry is widely applied to identify cells, count cells, and detect certain markers or microorganisms.
Comparing fluorescence microscopy and flow cytometry
Both fluorescence microscopy and flow cytometry measure the quantitative amounts of cellular components; however, they differ in aspects of locating cellular components, the volume of cells they can handle, and sample preparation prior to analysis.
Fluorescence microscopy can show how a component is distributed in the cell – uniformly or clustered in anatomical compartments. It can also show whether or not that concentration changes temporally or remains static.
Flow cytometry usually cannot specify where the component is exactly located inside the cell. This also means that when flow cytometry quantifies a cellular component, it does it on a whole-cell level, whereas fluorescence microscopy can quantify components within cellular compartments.
Fluorescence microscopy can usually quantify cellular components for tens or hundreds of cells. Flow cytometry, however, can handle larger volumes of up to hundreds of thousands of cells. Furthermore, flow cytometry can use fluorescent properties to distinguish and sort living cells in the thousands, while fluorescence microscopy is incapable of this.
To prepare samples for flow cytometry, the cells need to be in a monodispersed suspension; fluorescence microscopy does not require this. In addition, fluorescence microscopy can give information about cellular interactions, which is rare when using flow cytometry.
Fluorescence microscopy and flow cytometry in use
As mentioned, while fluorescence microscopy and flow cytometry achieve the same broader goals, they have their own benefits and advantages, making them suitable for different roles. When applied to the same sample, however, they can yield different results, as suggested by some research studies.
For example, when used to measure DNA fragmentation in semen, flow cytometry indicated higher measurements of spermatozoa damage. More specifically, flow cytometry indicated damage that was 2.6 times greater in comparison with fluorescence microscopy.
The experts are not entirely sure why this difference is observed. With fluorescence microscopy, subjectivity becomes an issue in addition to the length of the observations, because the fluorescent molecules become bleached.
However, flow cytometry also has some scope for variability. There are different methods to establish the population of interest and to estimate how many events are positive. A threshold must be set to measure the percentage of molecules positive for the fluorescent marker, but this threshold can be set using different reference samples and, thus, cause variability between studies.
Furthermore, for this specific study, DNA fragmentation in cells can be hard to detect. Fluorescent intensities are distributed in such as way that they overlap the autofluorescence, which is a natural light emission by structures such as mitochondria.
Sources
- https://www.bio.umass.edu/micro/immunology/facs542/facswhat.htm
- https://www.ncbi.nlm.nih.gov/pubmed/18636473
- serc.carleton.edu/…/fluromic.html
- https://link.springer.com/chapter/10.1007%2F978-1-4899-1866-6_6
Further Reading
- All Flow Cytometry Content
- Flow Cytometry Methodology, Uses, and Data Analysis
- Flow Cytometry Techniques used in Medicine and Research
- Flow Cytometry History
- Fluorescence-Activated Cell Sorting
Last Updated: Nov 20, 2018

Written by
Sara Ryding
Sara is a passionate life sciences writer who specializes in zoology and ornithology. She is currently completing a Ph.D. at Deakin University in Australia which focuses on how the beaks of birds change with global warming.
Source: Read Full Article
